Kron NPM can discover network topology and immediately start listening and polling discovered inventory. Kron NPM event listening module supports different protocols like SNMP trap, syslog, flow data and telemetry. For scalability purposes Kafka is supported in a built-in deployment or can be integrated with centralized Kafka cluster. Performance management module can be scaled horizontally and natively integrated with fault management module. Kron NPM can monitor network devices, IT elements and web services with wide variety of protocols.

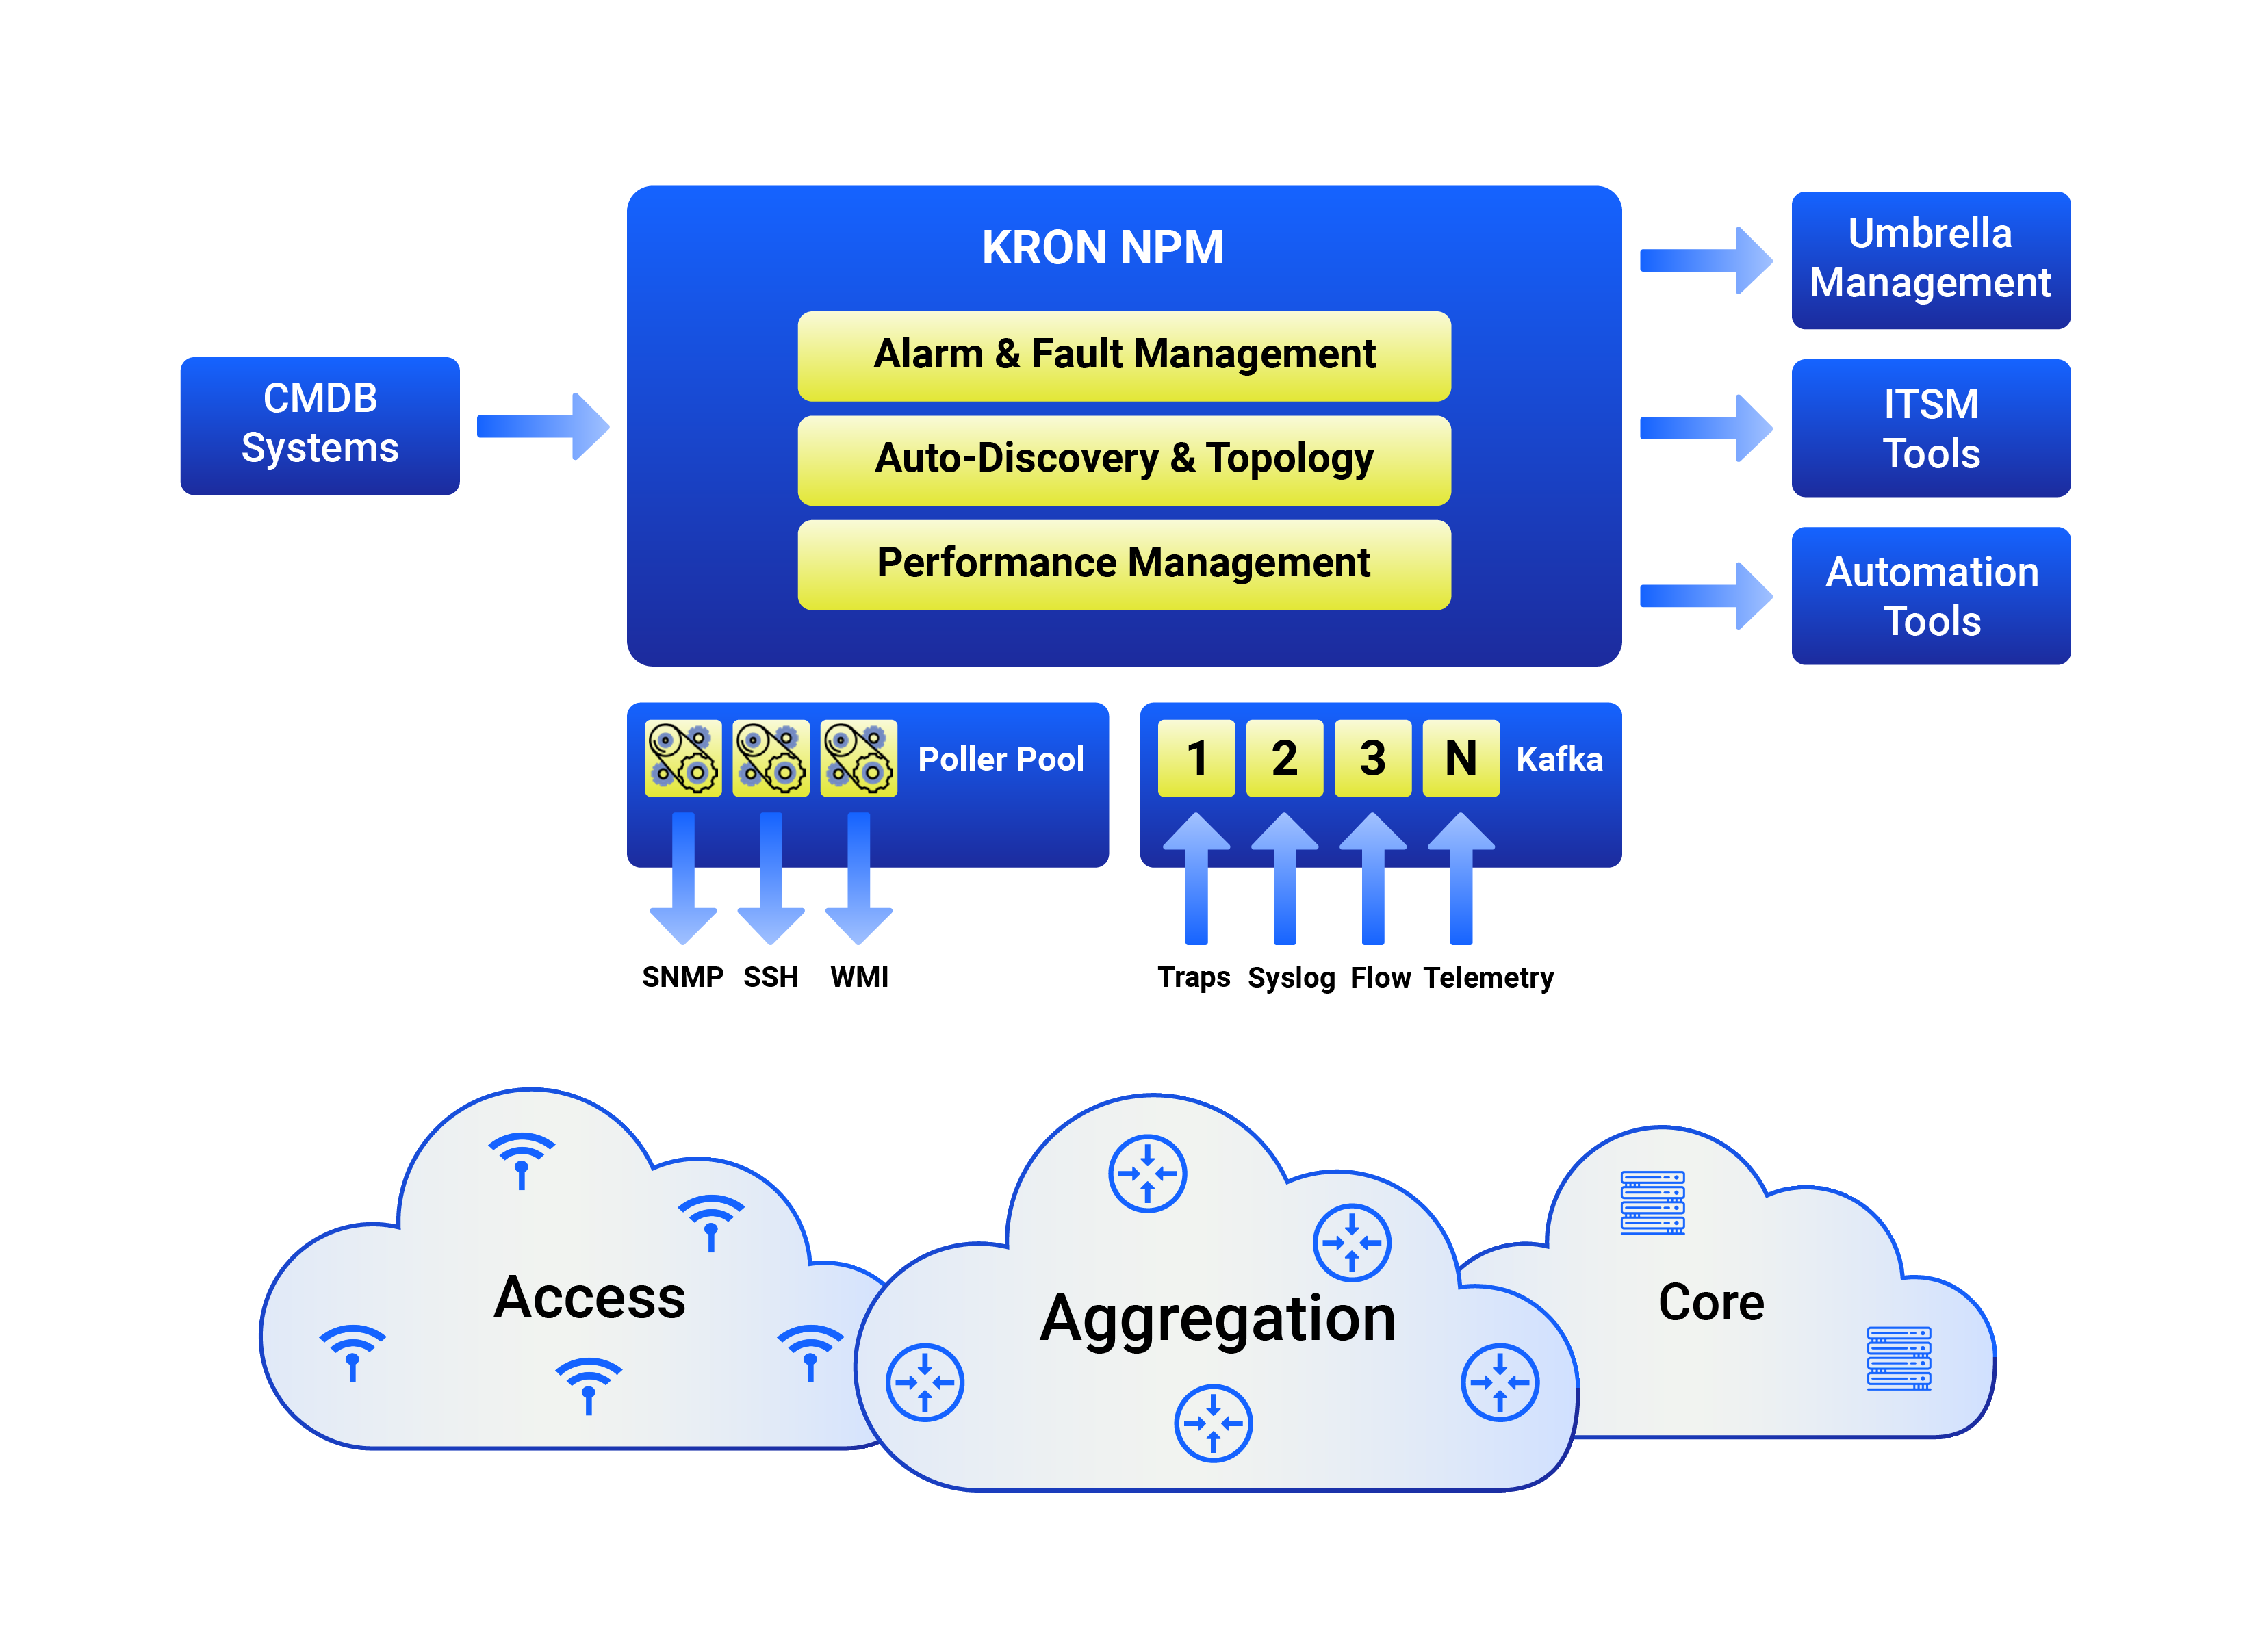
Kron NPM monitors and collects all performance and inventory data for all discovered physical and virtual devices and resources on available platforms such as routers, switches, load balancers, firewalls, Windows servers, Linux&Unix servers, Hyper-V hosts, Esx-i hosts, V-Centers and etc. With its flexible metric defining system Kron NPM lets any metric to be monitored if the device responds to the protocols we support. It also provides a personalized viewing experience with maps, topologies, customizable reports and dashboards. Traffic Analyzer utilizes flow data and turns this data in to observable insights and dashboards. It also monitors the network traffic on an application basis and provides the necessary data for capacity planning and optimization.
 SOLUTION
  HOW IT WORKS?
 KEY BENEFITS
 RESOURCES